
Point Cloud Display Style
 Ribbon: Point Clouds > Settings >
  View Mode
Menu: Point clouds >  View mode
Toolbar: Point clouds >
Functional toolbar Properties – Visualization – Change visualization >  button
 Command line: NPC_VIEWMODE
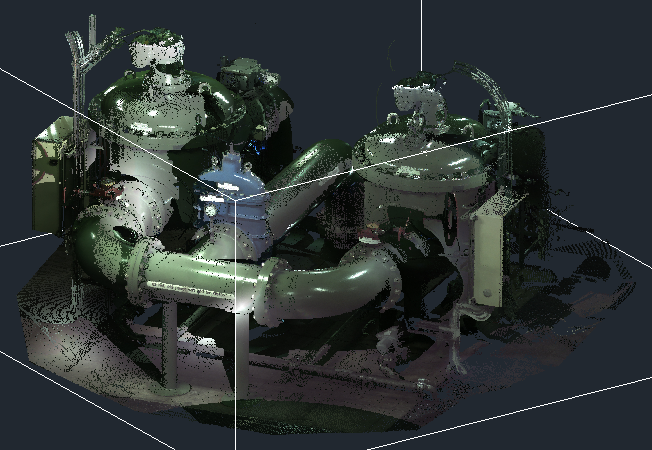
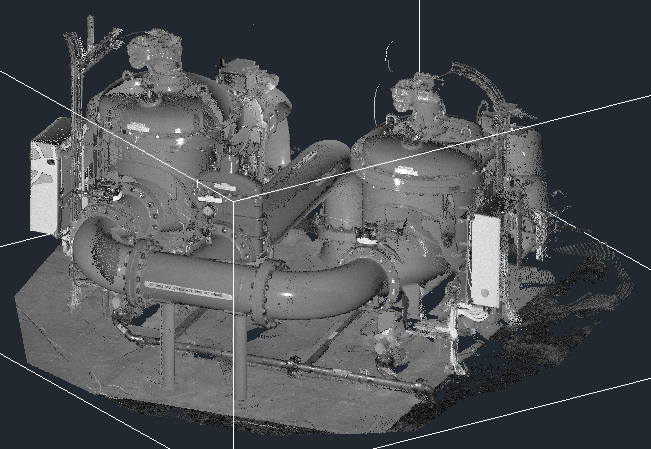
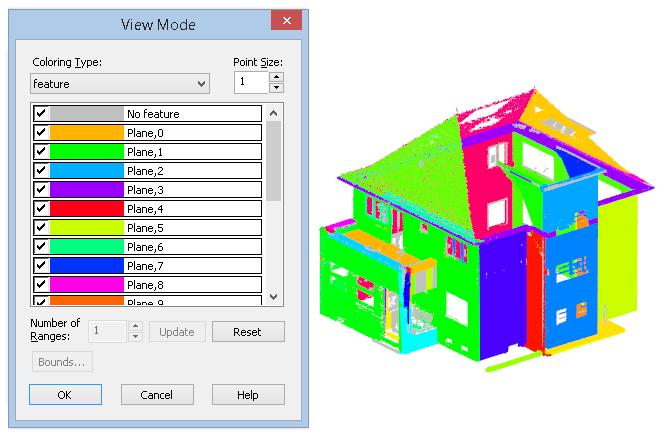
The command opens a dialogue box that allows you to stylize a point cloud in accordance with the values of these or those attributes of this cloud. In fact, the command paints each cloud point in accordance with the attribute value in this point. The user selects the attribute by stylize by. In case the necessary attributes are present in the cloud, stylization is possible by:
- color;
- elevation;
- intensity;
- scan color;
- source ID.
Also, you can color point cloud by selected color or cloud elevation (along the Z axis).
Options:
| Point Size: | The size of points in cloud in pixels. |
|---|---|
| Coloring type: | The list of available attribute values. |
 |
A drop-down list of cloud attributes available for stylization. The number of attributes in the list depends on which of them were imported together with the cloud from the scan file. |
| Number of Ranges: | Number of ranged of one color to divide cloud on. Click Update to save this number. |
 |
Updates the list of colors according to Number of ranges. |
Scan Color
Color the cloud according to points color in the source file.
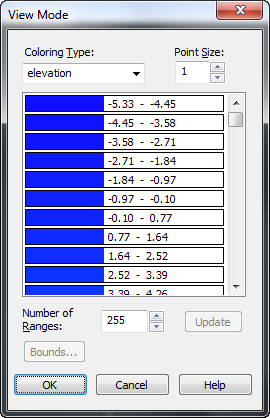
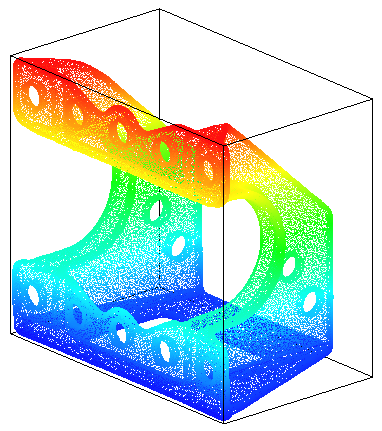
Elevation
Coloring depends on the Z-coordinate value in each point of cloud.

Intensity
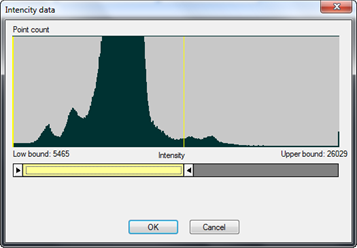
Coloring based on the intensity of the reflected pulse.
Click Bounds button to open chart of distribution intensity. You can exclude the part of low or upper bound using sliders.
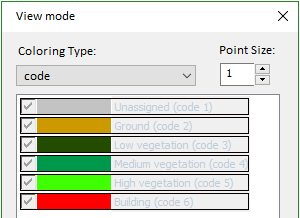
Code
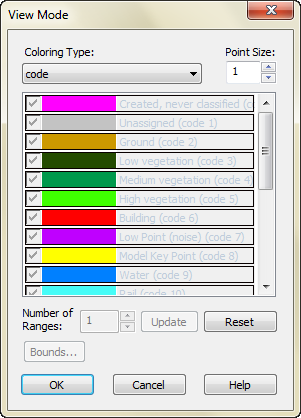
Color the cloud according to point classes. Points can be classified into a number of categories including bare earth or ground, top of canopy, and water. This coloring type may color the cloud with the Standard LAS Classification.
Unchecking the box next to the class allows you to disable the display of this class points in the drawing.
It is impossible to disable the display of classes and changes in their color, if classes were associated with layers in the document.
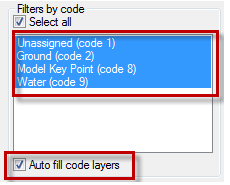
Such association occurs, for example, when importing point clouds with Auto fill code layers checkbox enabled. You can disable the display of class points associated with layers by disabling the display of layers in the Layers dialogue.
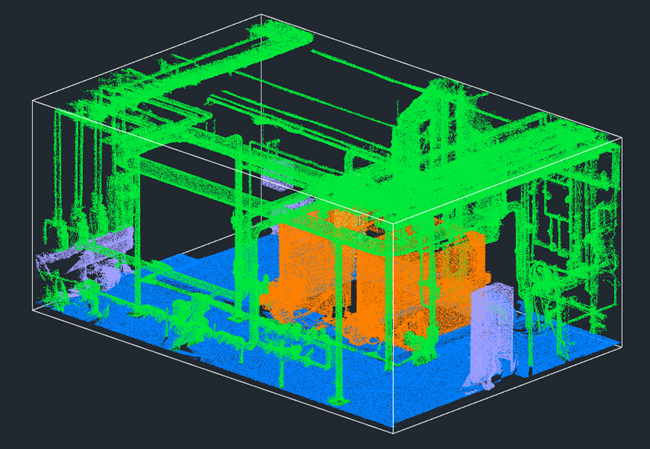
Echo number
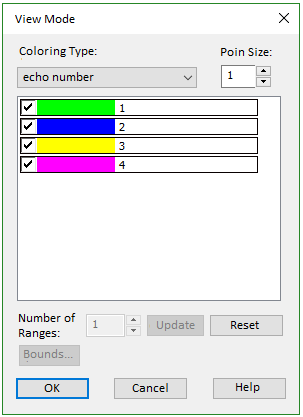
Color cloud according to reflection number of laser ray obtained as a result of scan. It is possible to disable visibility of points of any of reflection numbers by unchecking the corresponding box.
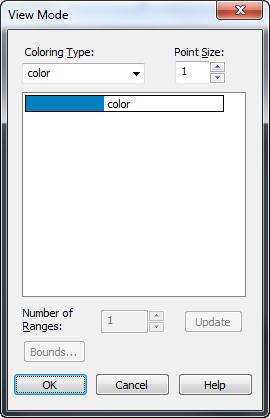
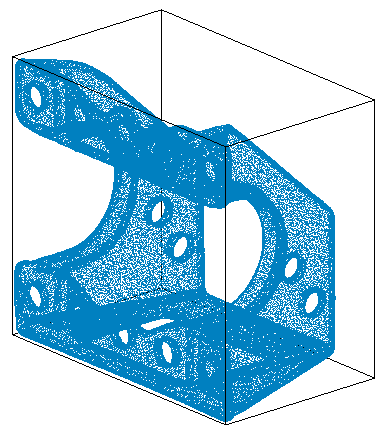
Color
Coloring all cloud points by selected color.
Source ID
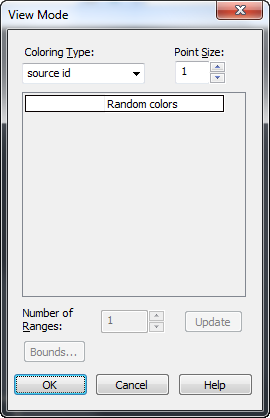
Coloring point cloud according to a unique source scan ID. One cloud can be formed as a result of several scans of one and the same object from different points. This type allows you to color the cloud points depending on the identifier of the scan source. Program selects color for every source automatically.
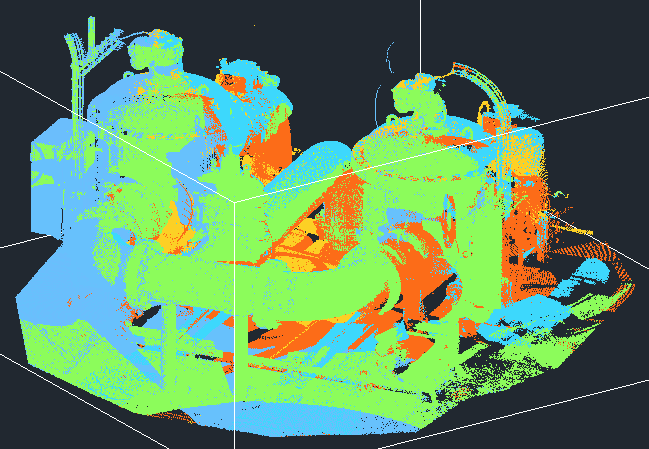
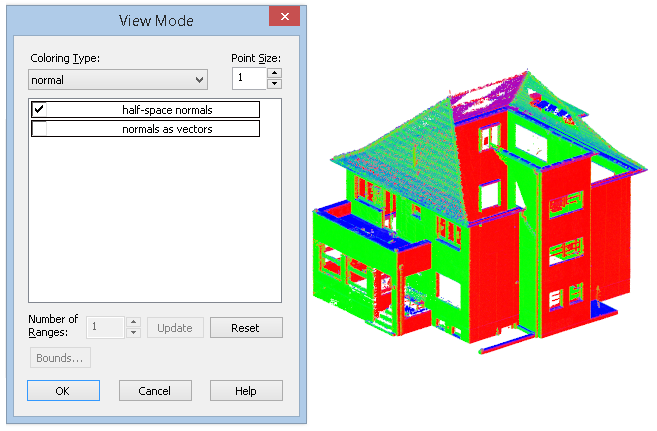
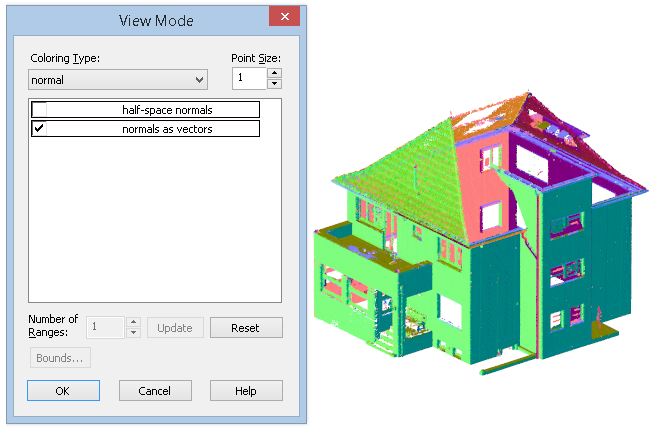
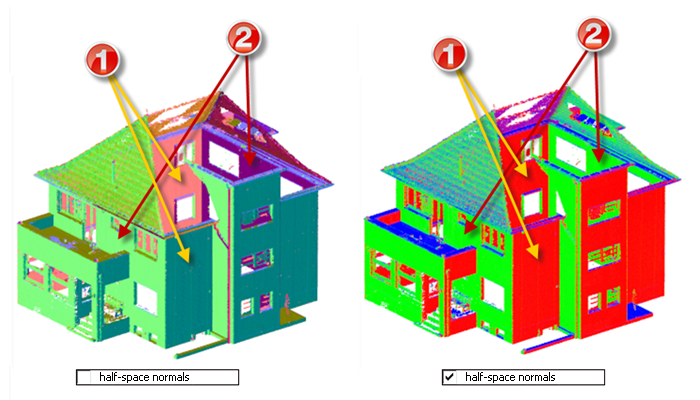
Normal
Renders the direction of cloud point normals, if present in the cloud. Cloud points are colored according to the direction of their normals. Points with normals collinear to a particular coordinate axis will have a color of this axis. Normals are created by cloud triangulation commands, features recognition commands, and fitting commands. It is also possible to recalculate normals.
Normals are created by cloud triangulation commands, features recognition commands, and fitting commands. Normals may not always be calculated correctly. In this case, it is recommended to recalculate the normals.
When the Halfspace normals box is checked, all collinear normal vectors begin to be displayed in the same color. So coloring does not distinguish between normals pointed in exactly opposite directions. This assigns them color equal to the interpolation of the colors of the axes of the current UCS. Points with normals collinear to a particular coordinate axis will have the color of that axis.
You can check the Normals as vectors box to display the normal vectors, and not just color the points of the cloud according to the directions of the normals. The size of the vectors on the screen depends on the size of the cloud point (Point size field). Normal vectors are only displayed when using DirectX as a hardware graphics accelerator.
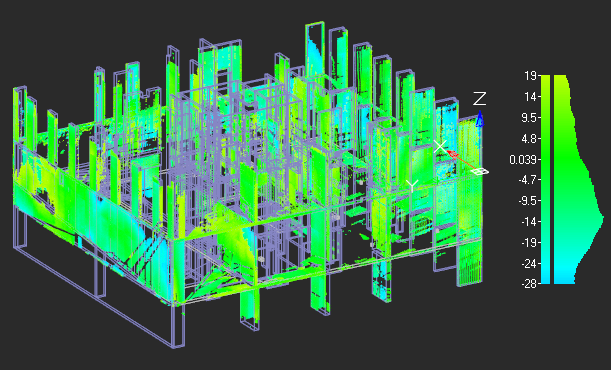
Deviation value
The Deviation value coloring type visualizes the size and direction of deviation of cloud points (the Deviation attribute) from the reference model (its vector representation or another cloud). Vertical application commands such as Compare Point Clouds can be used to calculate deviations.
The Bounds button displays the histogram of deviations with possibility to cut boundary values.
To disable the display of cloud points with deviations exceeding the limits of the allowable range, adjust the range limits with the sliders and check the Crop points box. When the box is checked, points that do not fall into the vicinity of the set deviation error (black) will be cut off regardless of the position of the cutoff boundaries.
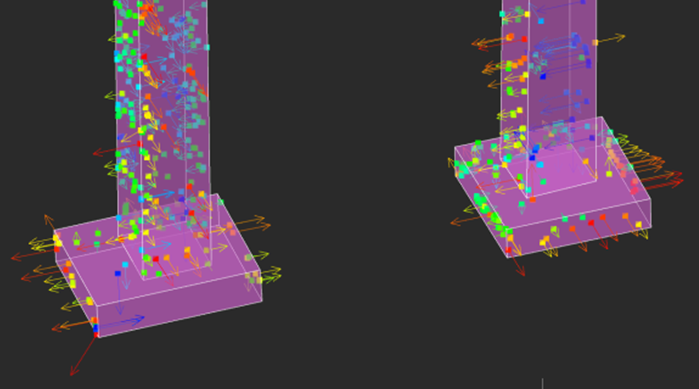
If, in addition to deviation values, deviation directions were also calculated, then the Display vectors checkbox will be available for the Deviation value coloring type.
To display the deviation directions on the screen, check the Display vectors box. The size of vectors on the screen depends on the size of the cloud point. Direction vectors are only displayed when using DirectX as a hardware graphics accelerator.
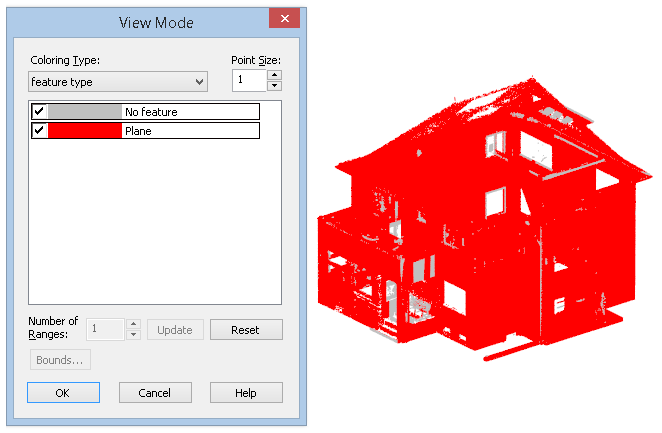
Feature and Feature type
These types of coloring are created by feature recognition commands. Used to displaying features recognized in point clouds.
Info: NanoCAD is a simple, cheap, and yet powerful, CAD application for Windows, that provides an outstanding user experience by providing top-level performance, full capability, a classic interface and native.dwg format support. nanoCAD has been built to deliver design and project documentation for all engineering purposes. nanoCAD includes a full suite of basic and advanced CAD tools for 2D/3D drawing and creating industry-standard DWG-compatible CAD files. Our freeware ensures creative, collaborative and customizable features to improve your efficiency, and includes a few API’s, allowing anything from routine task automation to complex CAD app development. You may download nanoCad for free, using the links below, and buy later, if you like it.
Post your comment on this topic.