
Insert Map Underlay
 Ribbon: Insert – Maps >
  Insert map
Ribbon: Topoplan – Maps >  Insert Map Underlay
Menu: Topoplan – Maps >  Insert Map Underlay
 Command line: MAPVIEW
Inserts map underlay into the current drawing.
Set the required parameters in the dialog box that opens.
The dialog allows you to load three types of maps: vector, raster or relief maps. Each type of map is set on its own tab in the right part of the dialog box.

Vector maps
The provider of vector maps is the OpenStreetMap service.
Go to the Vector maps tab.
In the representation window, select the desired area of import. The map is shifted with the left mouse button pressed, and scaled by rotating the wheel.
After selecting the desired area, the following settings are required at the bottom of the dialog box:

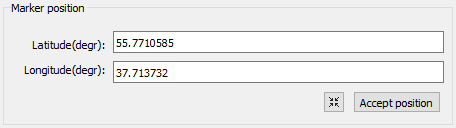
1. Specify position of the marker relative to which insertion in the drawing will be made. To do this, press the button for setting the marker 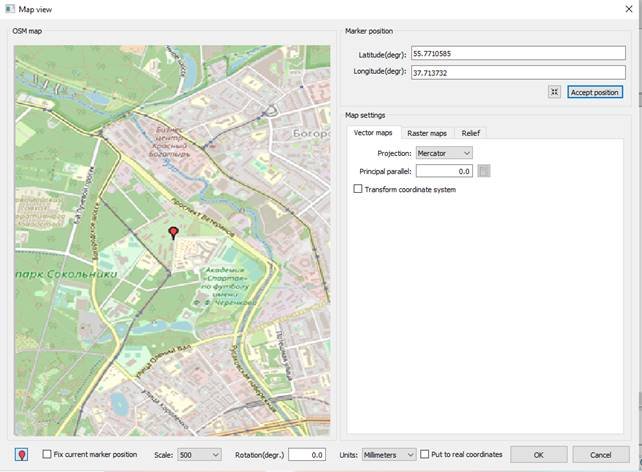 at the bottom of the dialog box. It is fixed in the pressed state. After that the marker’s position on the map is indicated by left double-click. In addition, the position can be specified by manually entering coordinates in the Marker position section.
2. Checking the Fix current marker position box fixes the last set position for all windows.
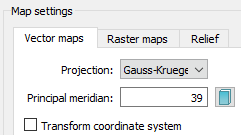
3. Set the map scale, rotation angle of the inserted fragment relative to the marker (positive angle indicates counterclockwise rotation) and drawing units.
4. On the Vector maps tab, select the projection of map representation in the drawing from the drop-down list Projection: Mercator, Gauss-Krueger or UTM.

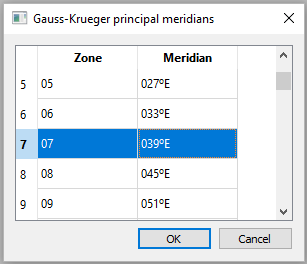
5. When selecting rectangular projections, specify the principal meridian of the zone. For the current marker position, the field is filled automatically, but you can select by the zone number from the corresponding dialog called by  button.
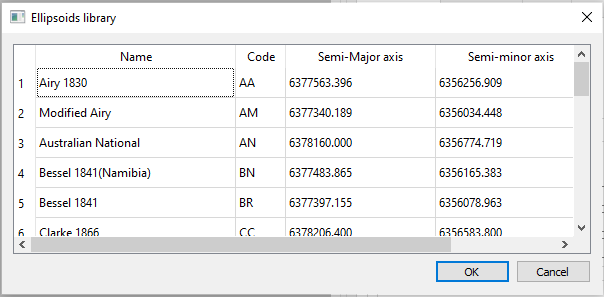
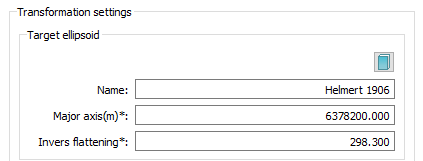
6. If it is necessary to recalculate coordinates from WGS84 ellipsoid, which represent the OSM service data, check the Transform coordinate system box. Then select the target transformation ellipsoid from the ellipsoids library opened by button.
Fields of the Target ellipsoid section will be filled automatically:
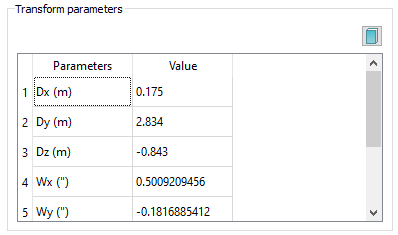
7. Then specify parameters of recalculation from WGS84 to the target ellipsoid. Seven-parameter Helmert transformation is used for recalculation. Upon calling the Helmert parameters dialog by button, select the required set of parameters:
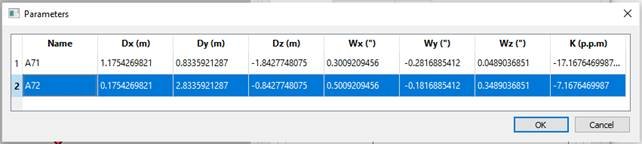
Fields of the Transform parameters section will be filled automatically:
The transform parameters are selected from the file transform_params.csv, which is located in the folder %nanocad%/UserDataCache/maplib/LIB and can be edited for adding new transformation parameters.
File fragment:
H7,A71,1.1754269821,0.8335921287,-1.8427748075,0.3009209456, -0.2816885412,0.0489036851,-17.1676469987
where:
- H7 – sign of transformation;
- A71- name (user identification);
- next three fields Dx, Dy, Dz – center offset relative to WGS84 center in meters;
- next three fields Wx, Wy, Wz – rotation of axes relative to WGS84 angular seconds;
- last field – scale factor in p.p.m. units (parts per million)- it is 1/1000000 from the factor’s complement to one.
After setting all necessary properties, click the Insert button and specify the insertion point in the drawing. The marker position will be placed at this point.
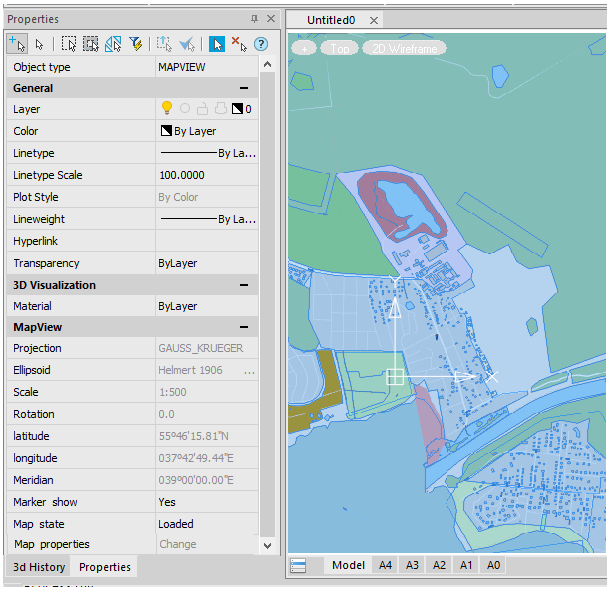
On the Properties toolbar, the following properties are displayed for vector map underlay: projection, ellipsoid, marker show, scale, rotation.
The marker display can be disabled (Marker show parameter).
Map underlays can be temporary unloaded, if necessary (Map state parameter). In this case, only the outline of underlay will be displayed in the drawing, without its content. The UNMAPVIEW REMAPVIEW commands allow group operations of uploading and downloading map underlays.
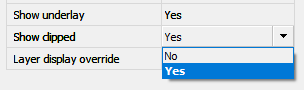
For loaded vector maps, a choice of displayed layers is available. To do this, click the button to the right of Map properties item.


To disable a layer, clear a box. Names of displayed objects and instruction for their display are given in columns on the right. Object display settings files are located in the folder UserDataCache/maplib/styles
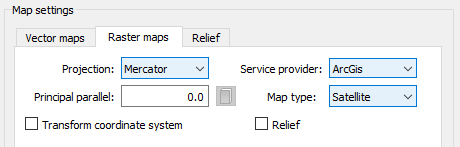
Raster maps
Providers of raster maps (Provider field) are several services: OpenStreetMaps, Google Maps, Yandex Maps, OSM Topo, MapBox, ArcGis, Bing.
In addition, some providers present different types of maps (Map type field): street maps, satellite, hybrid, terrain, topo.
Import setting is similar to that of raster maps.
Additionally, for raster maps you can specify the Relief option, which allows you to add terrain height to the raster. An image becomes a texture stretched over a 3D terrain model.
To insert raster cartographic underlays by control points, check the By control points box. After clicking the OK button, another dialog box will open, in which you will need to specify the source and resulting control pairs of points for which an attempt will be made to insert a raster map.

Stretch the preview areas of the current document (top left) and raster underlay (top right) if they are too small.
1. Click the plus 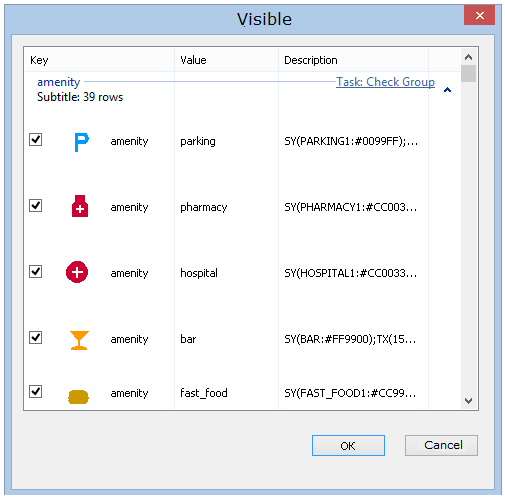 button.
2. Click in the left preview area of the current document to set the first target point.
3. Click in the right preview area of the raster underlay to mark the corresponding source point.
4. The coordinates of the first pair of points will appear in the left part of the dialog box.
5. Specify at least three more pairs of points. The points will change color from red to green.
6. To delete a pair of points, select it in the table and click the minus
7. By clicking the Test button, you can see the conversion results and the maximum error. To exclude a pair of points from the calculation, it is not necessary to delete it, just uncheck the box next to it.
8. If the conversion result is satisfactory, click ОK.
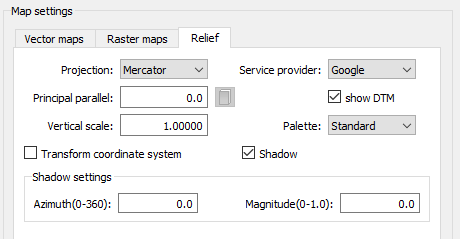
Relief

The Relief tab allows using 3D terrain model as an underlay.
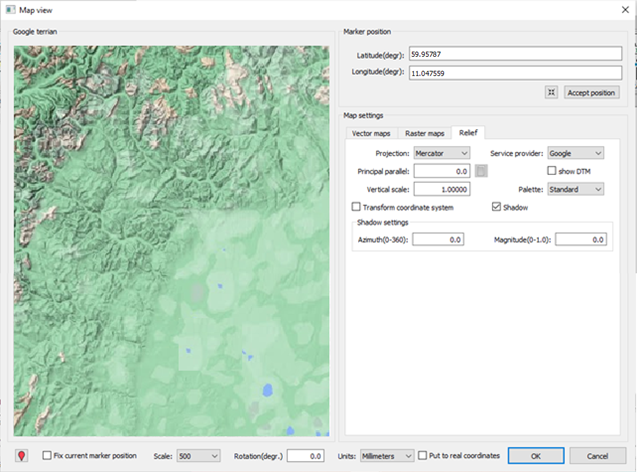
To select the area, relief raster images of Google or satellite images of MapBox are used. The model provider is MapBox service. In addition to standard import settings, the following are available: vertical scale of relief, selection of height color palette, shadow.
The show DTM checkbox allows displaying actual DTM in the window when selecting MapBox provider.
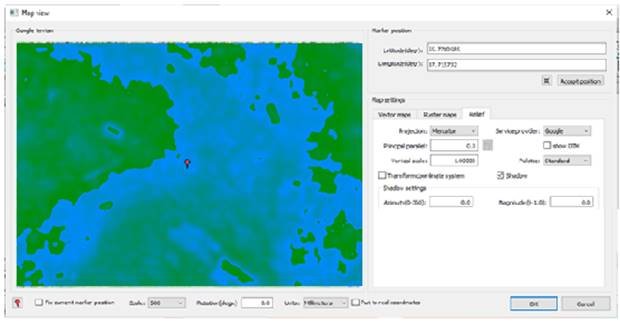
When selecting “Shadow” item, shadow parameters become available

For underlays of Relief type loaded in a drawing it is possible to change the relief parameters. To do this, click the button to the right of Map properties item.

Post your comment on this topic.